


應用類神經網路及遺傳演繹方法於財務預測上。可以結合傳統和AI技術建立交易系統。
財金預測,包含股票、外匯、期貨、指數…等等交易系統。
Build stock market, futures, index and forex trading systems WITHOUT coding!
NeuroShell Trader’s point and click interface allows you to easily create complex technical analysis indicators, trading systems and neural network market forecasts without coding of any kind.
Point and Click
Easily create complex neural networks, trading systems and indicators with no programming necessary.
Use YOUR rules, indicators, and formulas to analyze today’s volatile markets, without writing any code. Instead, use our point and click “wizards” for
Use YOUR rules, indicators, and formulas to analyze today’s volatile markets, without writing any code. Instead, use our point and click “wizards” for indicators, predictions, and trading systems. For example, create multiple variations of the same indicator, such as 9 and 13 period moving averages, in one pass through the indicator wizard.
The indicator wizard allows you to build complex indicators by combining a number of the 800 included indicators. You can save these “custom” indicators for use in other trading systems. The prediction and trading strategy wizards also allow entire systems to be combined, so you can build “ensemble” systems with more power to find profitable trades. Save your favorites as templates for later use.
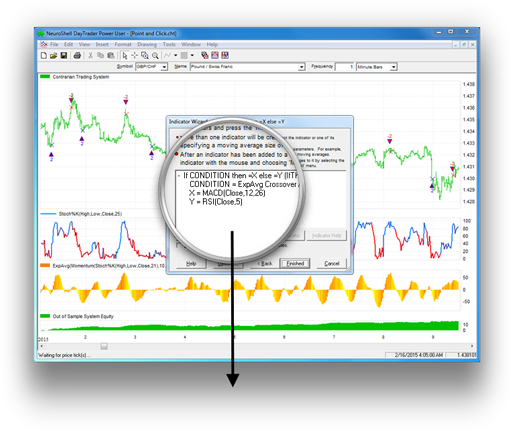
Use NeuroShell Trader’s multi-layered wizards to quickly build complex trading logic.
Chart Based
Quickly develop and test trading systems in a charting interface
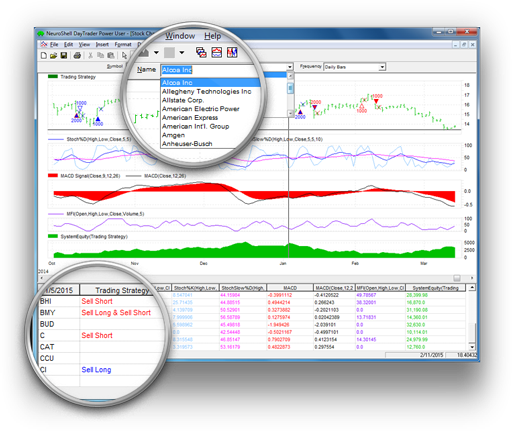
Charts are the major component of NeuroShell. You may open many charts at one time, either new ones or ones you have previously built and saved. When you create a new chart, you specify their periodicity with which you want to see and process the data, as well as how far back in time you want to load the data. Next you specify the related instruments whose historical data should be loaded into the chart. They are the target instruments for which you wish to create trading signals.
Multiple instruments in the chart show up in their own chart page. For example, let’s say you load IBM, DELL, HPQ, and AAPL as your target instruments. (They don’t have to be stocks; they can be FOREX pairs, commodities, E-minis, options, etc). Note that you can insert several different models in a chart. Once you insert a model, it automatically applies to all chart pages.

Pyramiding Scaling Fixed Shares
Pyramiding
Position Sizing in NeuroShell Trader
Multi Core Distributed Optimization in NeuroShell Trader
Optimization Algorithm in NeuroShell Trader
Neural Nets Overview in NeuroShell Trader
Multiple Template Optimization and Backtesting
Drag and Drop Subgraphs
Multiple Frequencies on the Same Chart
How Optimization Works in Trading Strategies
Advanced Predictions
Custom Indicators
How Optimization Works in Predictions